USDA-AMS Market Reports provide hay price transparency
June 2021
Bring a fair hay price: USDA-AMS hay market reports provide forage transparency
The U.S. Department of Agriculture-Agricultural Marketing Service (USDA-AMS) prepares weekly hay market reports for major market outlets around the country. Weekly reports, a service of the agency’s Livestock, Poultry & Grain Market News (LPGMN) division, provide data from 12 major hay auction locations from Wyoming to Virginia, as well as from 16 major hay-producing states, to provide producers with hay price ranges for a variety of crops — from dairy-quality alfalfa to grass hay.
“The objective of hay market reports is to describe the trade in an accurate, adequate and appropriate manner,” according to a handbook provided by Levi Geyer, hay market reporter and USDA-AMS LPGMN assistant field chief in New Holland, Pennsylvania.
How USDA-AMS grades common forage types
In establishing the basis for hay prices, the agency’s hay market reporters apply general quality grading guidelines for different forage types, namely alfalfa and grass hay because “official USDA hay standards/grades do not exist,” according to the handbook provided by Geyer. “But, for market reporting purposes, there are hay quality designations and guidelines based on hay test parameters.”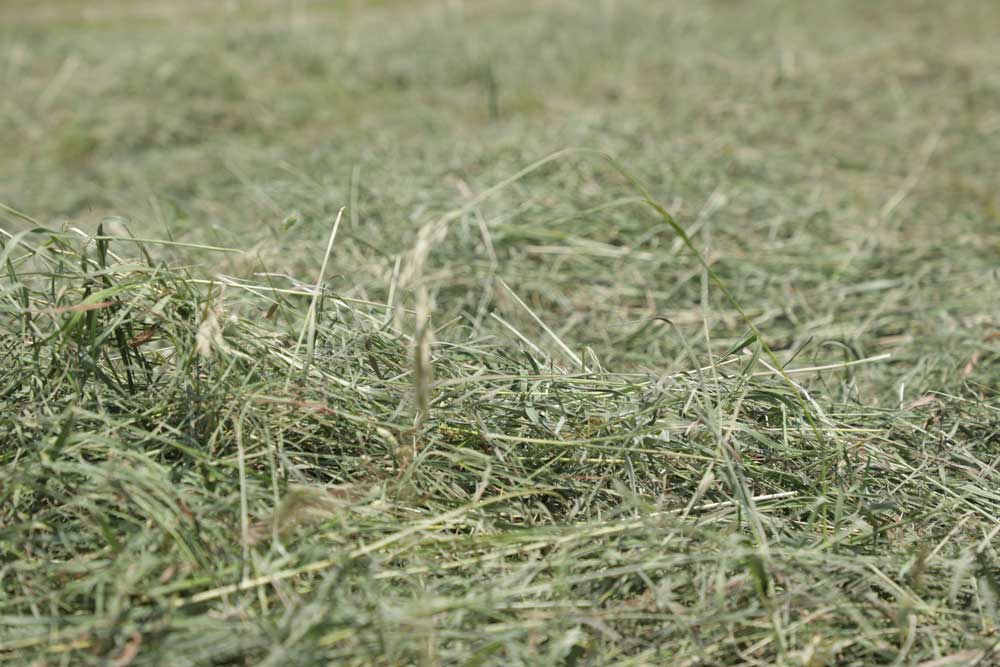
There are several data points that reflect specific physical attributes of hay and its value as a feedstock. For alfalfa, according to AMS, those designations are supreme, premium, good, fair and utility, which are based on relative feed value (RFV), total digestible nutrition (TDN), crude protein (CP) and fiber content — namely acid and neutral detergent fiber (ADF and NDF), both of which influence the overall digestibility of hay.
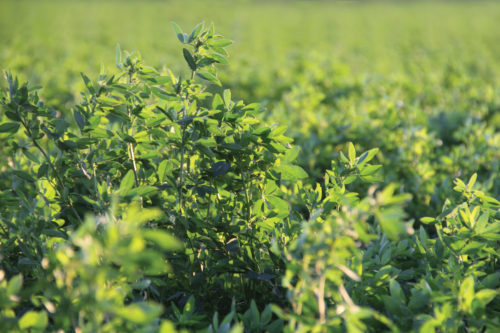
- Supreme: Highest nutritive content with very early maturity, pre-bloom, soft-stemmed and extra leafy. Hay is excellent color and free of damage.
- Premium: Early maturity, extra leafy and fine-stemmed with high nutritive content. Hay is green and free of damage.
- Good: Early to average maturity, leafy, fine- to medium-stemmed and free of damage other than slight discoloration.
- Fair: Late maturity, moderate or below leaf content and generally coarse-stemmed. Hay may show light damage.
- Utility: Very late maturity, coarse-stemmed, hay discounted due to excessive damage and heavy weed content or mold. Defects will be identified in market reports when using this category.
The following chart shows the ranges by quality classification that are commonly accounted for in pricing hay.
| RFV | TDN | CP | ADF | NDF | |
| Supreme | 185 or above | 62 or above | 22 or above | below 27 | below 34 |
| Premium | 170 – 185 | 60.5 – 62 | 20 – 22 | 27 – 29 | 34 – 36 |
| Good | 150 – 170 | 58 – 60 | 18 – 20 | 29 – 32 | 36 – 40 |
| Fair | 130 – 150 | 56 – 58 | 16 – 18 | 32 – 35 | 40 – 44 |
| Utility | 130 or below | 56 or below | 16 or below | 35 or above | 40 or above |
Grass hay is also included in regular weekly AMS hay market reports. Prairie grass hay, a specific forage category AMS tracks, is part of the grass hay market report and is graded strictly by its crude protein contents. Premium grass hay has CP over 13%, good has 9% to 13%, fair has 5% to 9% and utility has under 5%.
Landing on prices for each forage category and quality grade
With those categories in mind, how should producers use these reports to market hay? The overarching goal of hay price reports, according to the handbook provided by Geyer, is to only reflect general pricing trends and provide basic commentary about the reasoning for those trends. Unlike CME Group grain prices, the figures given in USDA-AMS hay reports are based on observed sales and provide a general guideline for pricing, not a specific price.
A few key terms according to the USDA-AMS hay report handbook are:
- Every quotation, if possible, should be a general price range covering the bulk of the sales of a specific commodity and its quality.
- A “mostly” price represents the price a majority of sales are made at.
- Weighted average prices show where the bulk of sales occur — reflect supply and demand, and the trading price and volume range for a given time period.
Prices provided in the weekly reports are based on actual sales whenever possible, but specific ranges for each hay type and quality are also given in nominal terms, meaning they’re more a reflection of general buyer and seller observations. That’s most often the case when hay price ranges haven’t changed from week to week, or no trade was reported.
Other market price variables that are typically outlined in each USDA-AMS hay market report include:
- Specific market geography. This includes a region of a state like “northwest Kansas” or focuses on an area around the city or town where a large regional hay auction is held.
- Hay format/size. This includes bale size, whether large round, large square or small square bales. For alfalfa, it also includes whether the forage has been pelletized.
- Transportation. Most hay prices are given on a free on board (FOB) basis, which does not account for transportation or delivery costs.
- Deferred delivery or shipment. While a lot of hay is designated as simply “delivered,” some purchase hay for deferred delivery, which is sometimes specified in market reports.
- Quality/condition. This includes forage moisture content, cleanliness or other quality variables that aren’t normally included in standard AMS quality designations.
- Premiums. These variables are included in the sale price when they have substantial impact on the hay or sale transaction. For example, sellers may charge premiums for hay stored indoors prior to sale. Or transportation methods are another variable to charge for at the point of sale.
How to use USDA-AMS hay market report data
Hay producers want to bring in top dollar for every bale they sell, and buyers want to know they’re paying exactly the right hay price. While those two admittedly don’t always align, USDA-AMS hay reports can help keep nominal prices within range and provide a basis for pricing that accounts for local supply and demand in each market. Armed with the pricing data in those reports, sellers cannot only know the price comparisons in the closest markets, but also where it is most cost effective to sell bales based on supply and demand at that time.
“We’re close to the Platte Valley market, so we use those reports. And whenever it’s dry in Kansas, we’re the first ones sending hay south because freight is a major cost-difference maker for us,” said Pete Hamel, an Arapahoe, Nebraska, cattle and forage producer. “We use the USDA-AMS hay reports as a sort of guideline for pricing. We’ve sold hay at the Fort Morgan and Brush, Colorado, markets, but if I can get it sold closer and not have the exercise of trucking it, that helps a lot.”
Hamel has had inquiries from buyers as far away as Waco, Texas, so he uses both his local market price ranges and those from his buyers’ local areas to get a feel for how to price hay, including brokerage and transportation costs.
“Your location makes a big difference, and freight is no small factor to consider. I watch those USDA-AMS hay market reports religiously. Anybody who’s serious about being in the hay business pays attention to them,” Hamel said. “The ultimate goal is to get as much as you can for what you produce.”
Each week, USDA-AMS updates hay market reports for the major auction sales locations as well as statewide direct hay sales price ranges. Reports are released at different days and times each week, so check here to see the latest price data for your area. If you have questions about the hay price reports available in your area, contact your state AMS Livestock, Poultry & Grain Market News office.
Information noted above was gathered from a third party who was advised his/her experience might be featured in marketing materials. This article contains third-party observations, advice or experiences that do not necessarily reflect the opinions of Vermeer Corporation, its affiliates or its dealers. Individual results may vary based on care and operation of machine and crop and field conditions, which may adversely affect performance. Vermeer Corporation reserves the right to make changes in engineering, design and specifications; add improvements; or discontinue manufacturing at any time without notice or obligation. Equipment shown is for illustrative purposes only and may display optional accessories or components specific to their global region.
Please contact your local Vermeer dealer for more information on machine specifications. Vermeer and the Vermeer logo are trademarks of Vermeer Manufacturing Company in the U.S. and/or other countries.© 2021 Vermeer Corporation. All Rights Reserved.

